The Choke, Live
At 6:40pm local time on July 20, 2026, Houthi military spokesperson Yahya Saree announced a maritime embargo against Saudi Arabia, effective immediately. Deputy head of the Houthi media office Nasruddin Amer framed it on X as retaliation for what he called Saudi Arabia’s “unjust blockade on Yemenis for over 10 years.”1 Within hours, Houthi forces fired missiles and drones at Saudi Arabia’s Abha International Airport, the most significant direct confrontation between the two in years, while open-frequency broadcasts warned that the Bab el-Mandeb strait was closed to Saudi shipping and that vessels attempting passage were subject to attack.2 No enforcement mechanism was specified. None was needed. A tanker captain doesn’t wait to find out if a threat is credible before rerouting or paying the insurance premium that assumes it is.
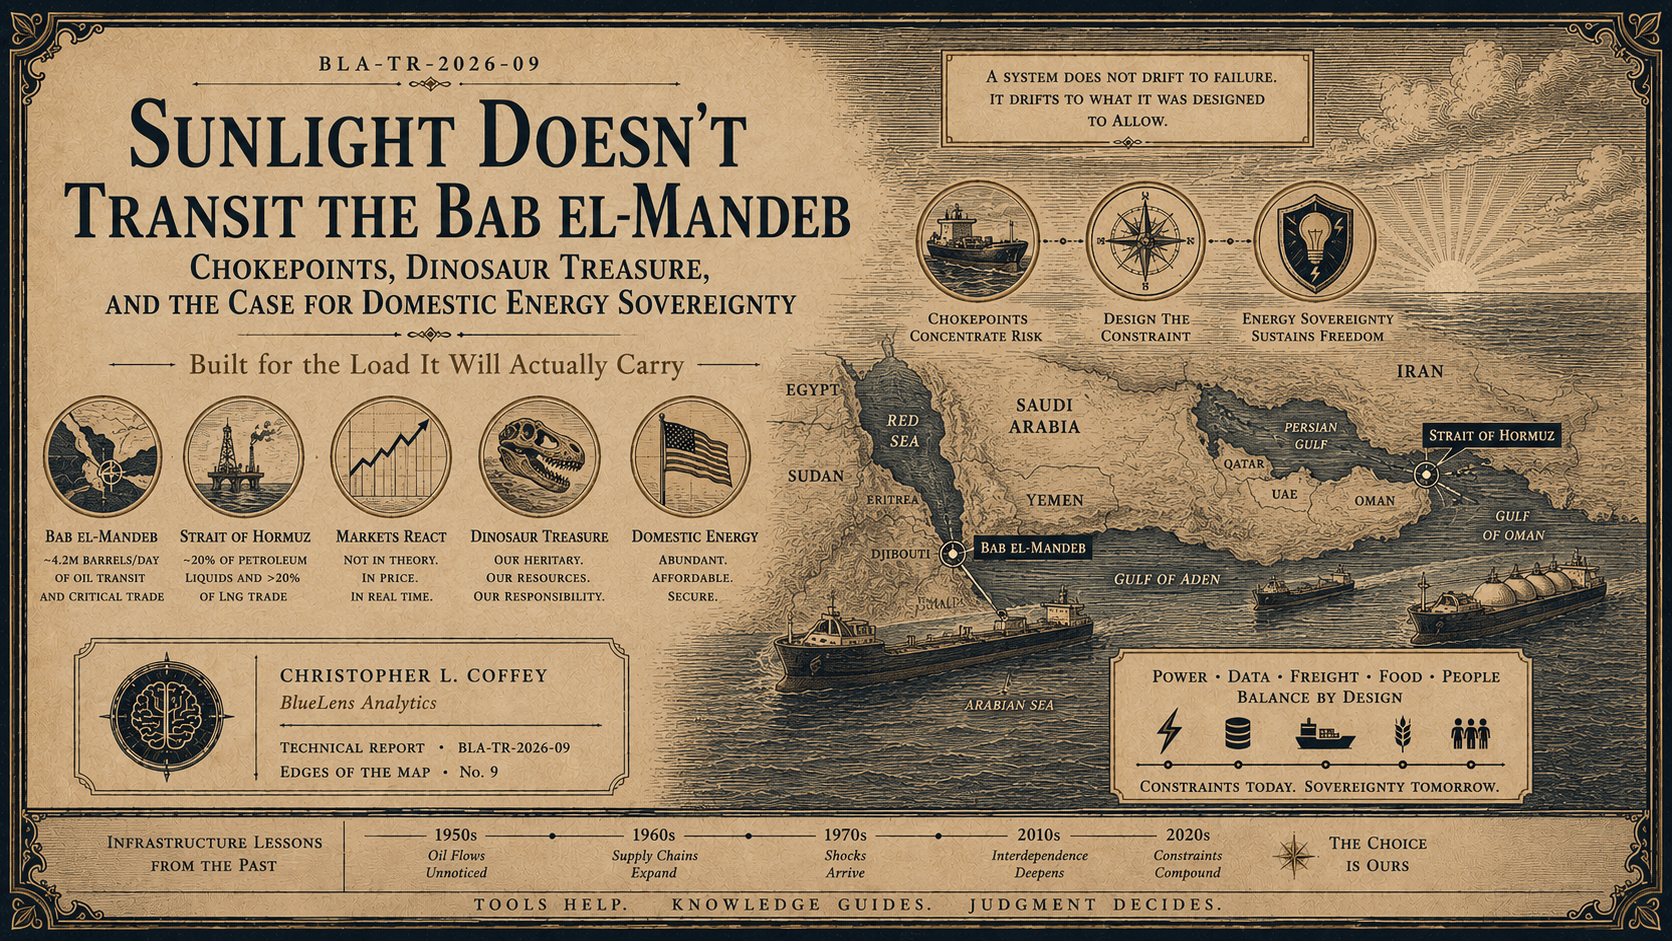
That declaration landed inside a strait that carries something on the order of 4.2 million barrels of oil a day, alongside a share of the roughly 12 percent of global trade value and a quarter of global container traffic that routes through it.3 Those are three different measurements, oil volume, trade value, and container count, and should not be blurred into one number. Each independently marks Bab el-Mandeb as one of the handful of waterways the global economy cannot easily route around.
It also landed inside a second closure that was already five months old. The Strait of Hormuz, which under normal conditions carries roughly 20 percent of the world’s petroleum liquids and more than 20 percent of its LNG trade, has been effectively shut since Iran closed it on February 28, 2026, following US and Israeli airstrikes.4 The closure hasn’t stayed fixed. Iranian forces claimed complete control of the strait in early March. A US-led campaign to reopen it began March 19. A full American naval blockade of Iran followed on April 12. A ceasefire brought a partial reopening in mid-June. That ceasefire collapsed on July 8 after Iranian strikes on shipping, and the US blockade was reinstated on July 14, six days before the Houthi announcement piled a second closure on top of the first.5 Brent crude, which closed at $71.32 a barrel the trading day before the war began, up from the low $60s two months earlier, spiked to a confirmed peak of $138.21 on April 7 and had fallen back to $92.84 by June 11, only for that relief to evaporate three weeks later.6 The specific number matters less than the shape of the line. This is not one shock being absorbed and forgotten. It is a market that has now been pulled through a full cycle of closure, partial relief, and re-closure twice in five months, with a second waterway added to the disruption this week.
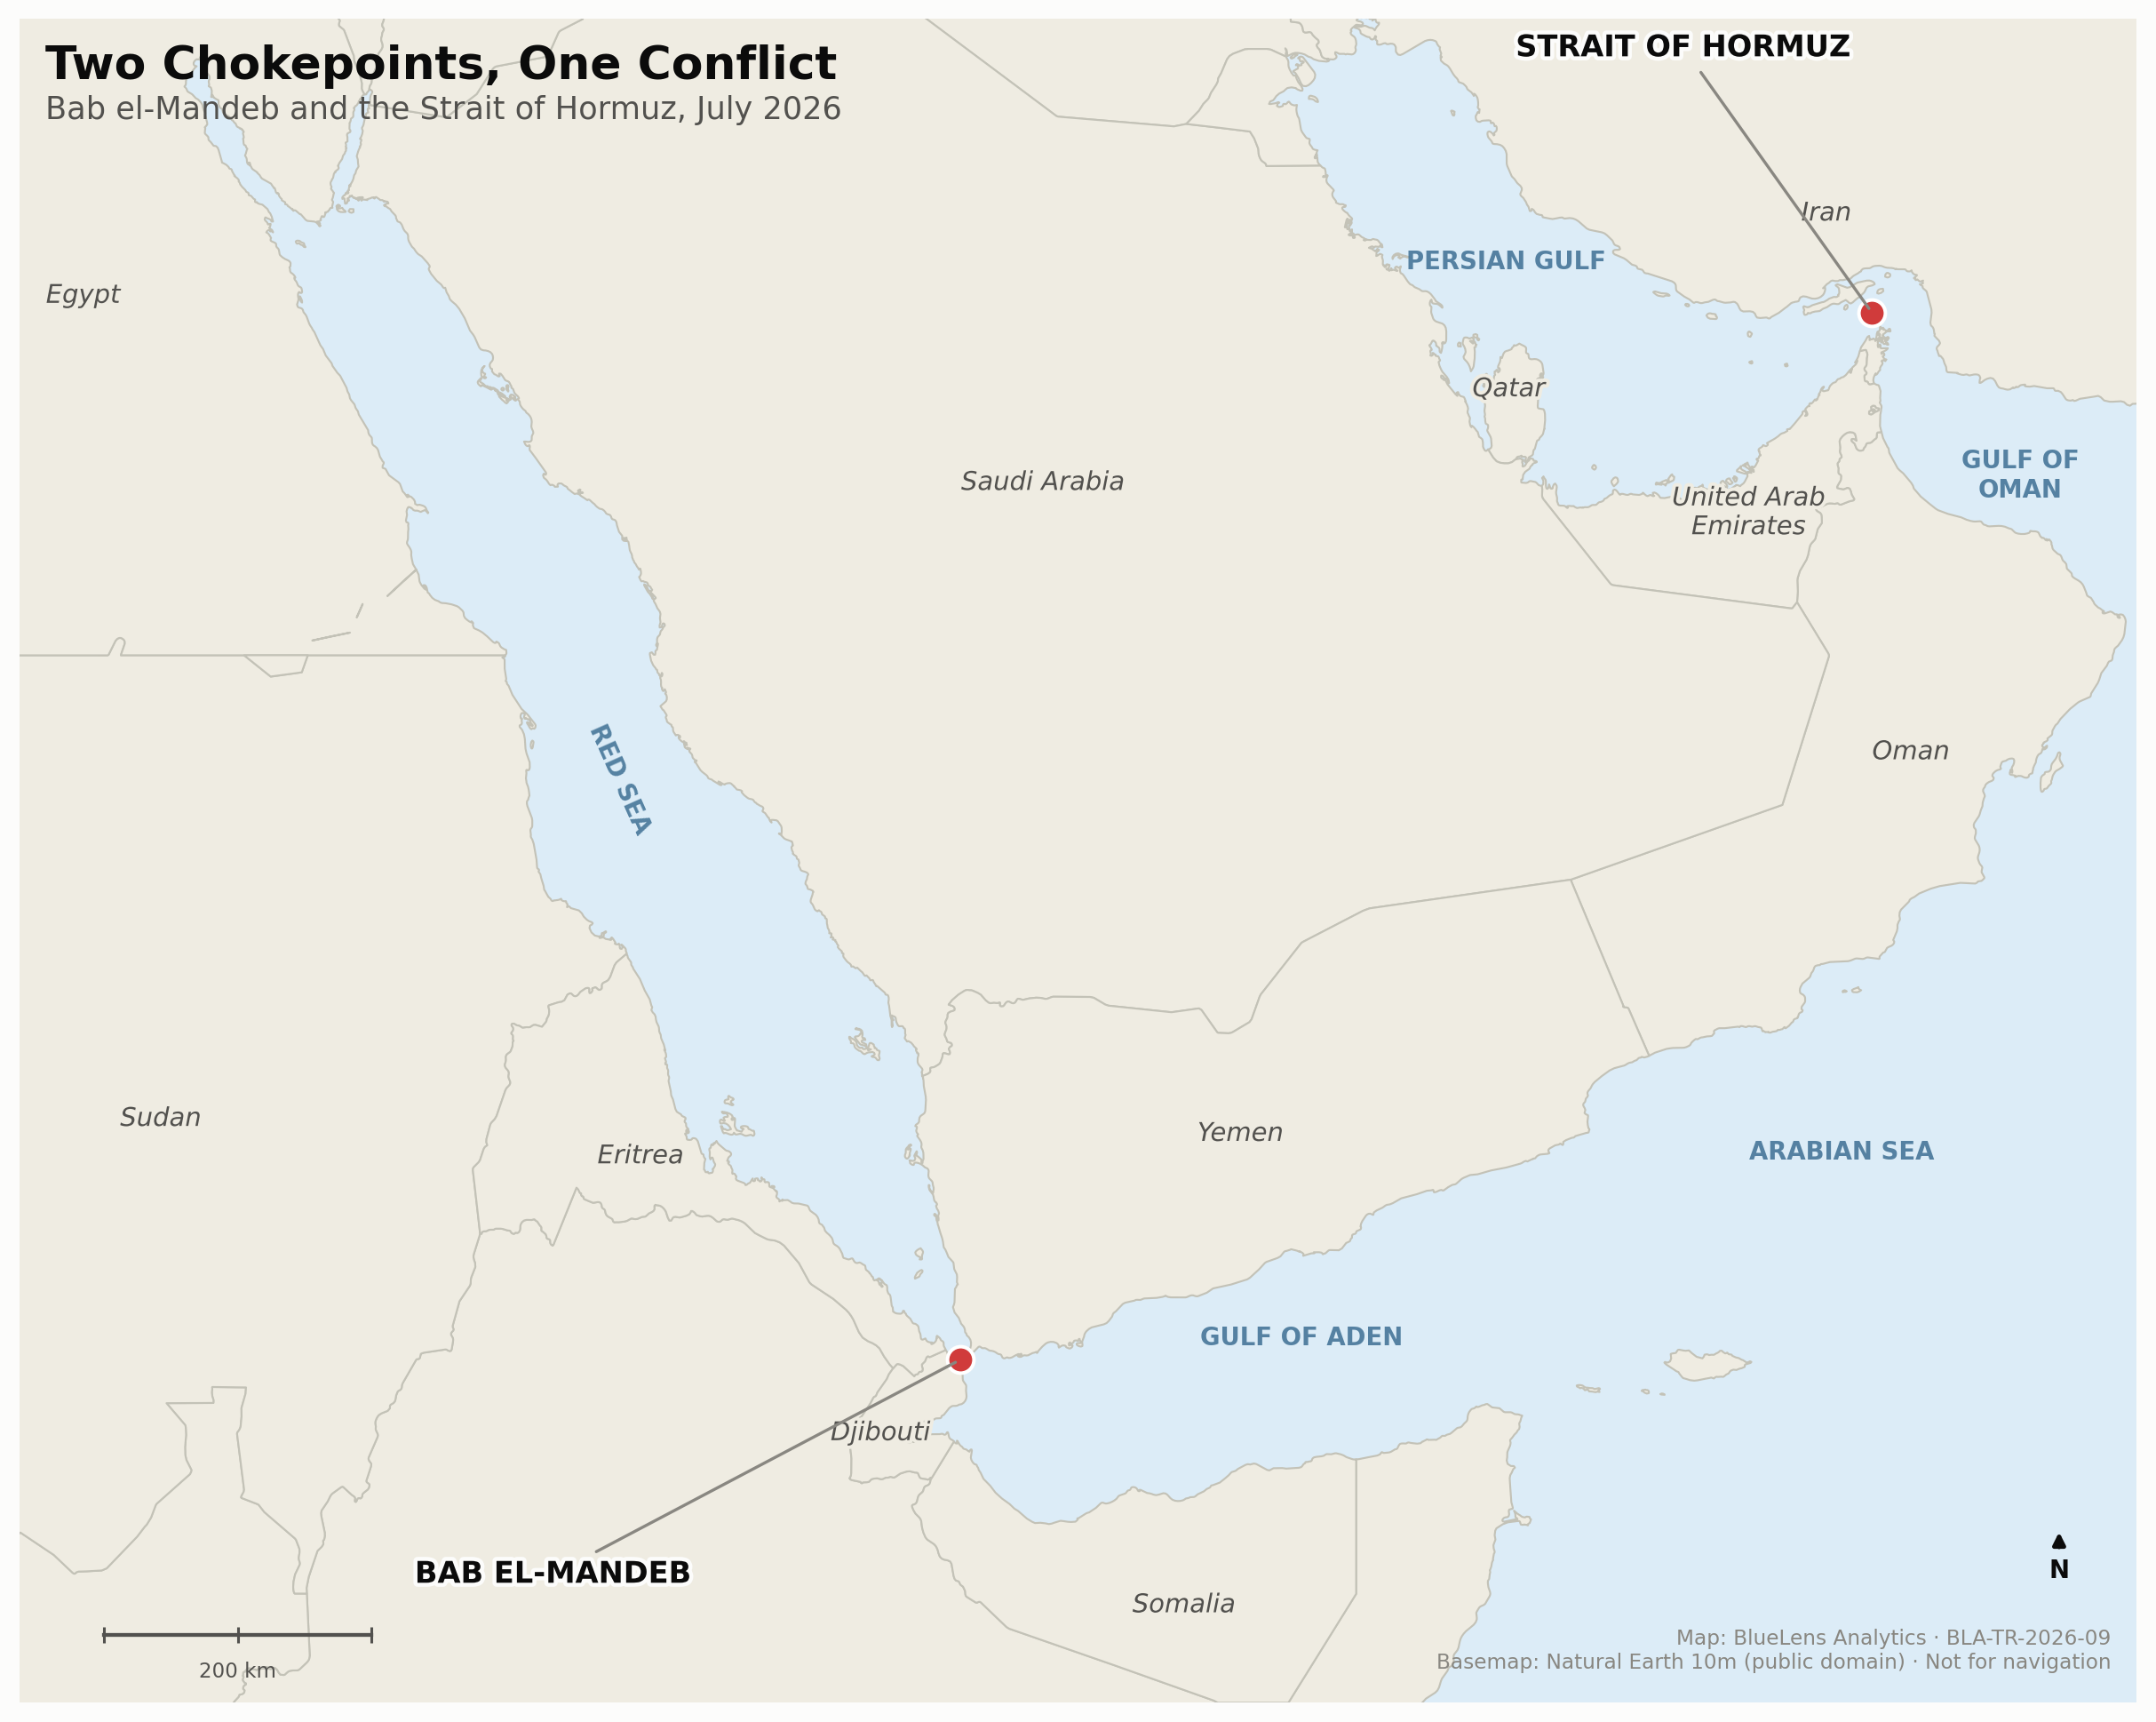
Figure 1. The two chokepoints this report opens on. Map: BlueLens Analytics, BLA-TR-2026-09. Basemap: Natural Earth 10m (public domain). Not for navigation.
None of this is new in kind, only in scale and simultaneity. On July 25, 2018, Houthi forces attacked two Saudi-flagged supertankers near this same strait. Saudi Arabia responded within a day by suspending all its oil shipments through Bab el-Mandeb, and an oil-industry analyst quoted at the time put the resulting price bump at roughly a dollar a barrel.7 The pattern making news this week is eight years old. What’s different is that it no longer resolves into a “situation becomes clearer” statement and a return to normal. It is layered on top of an already-closed second chokepoint, which turns what used to be a shock into something closer to standing weather.
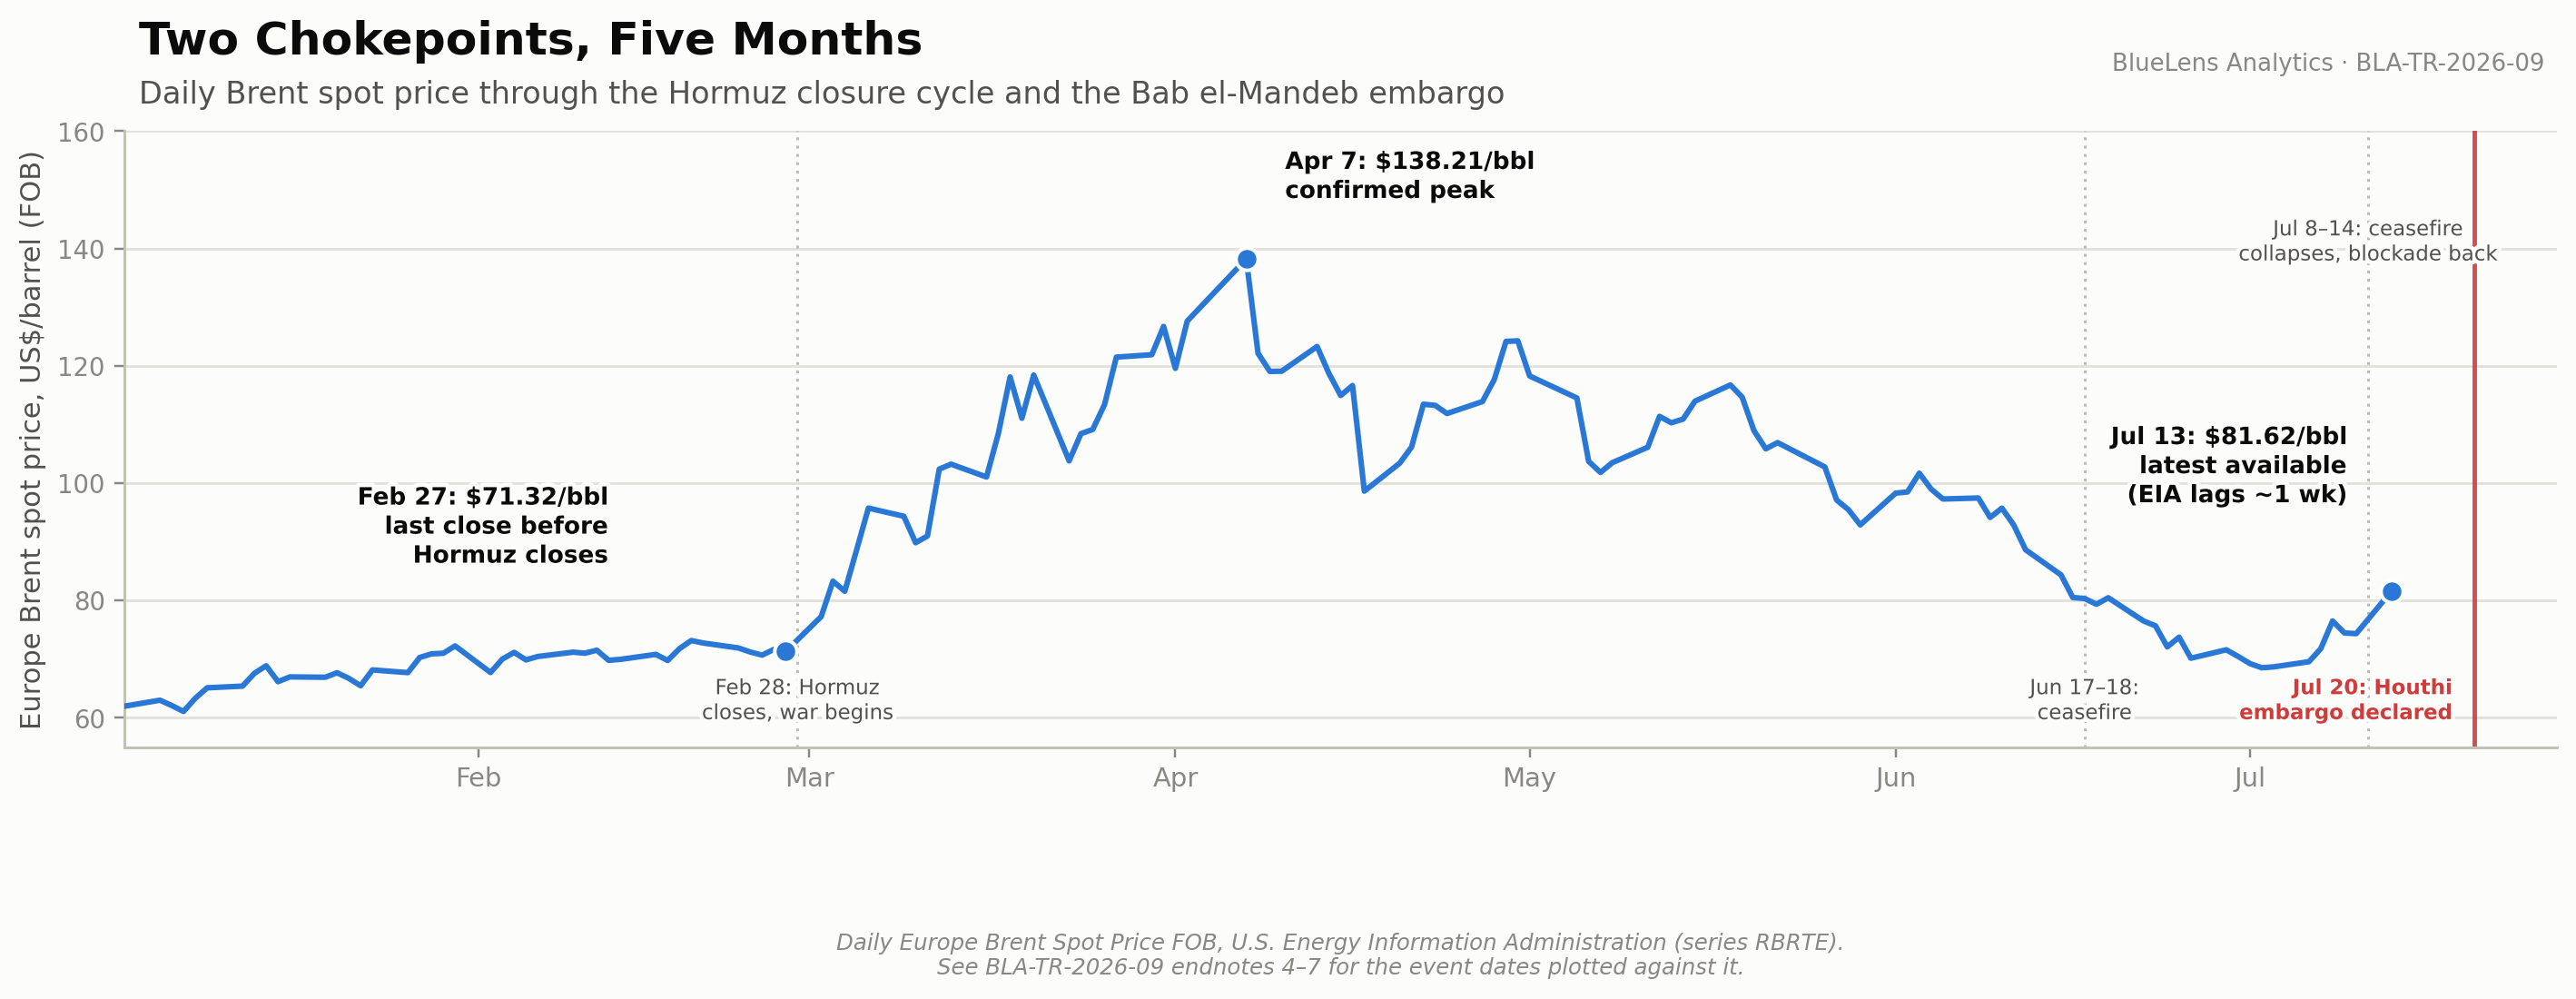
Figure 2. Daily Europe Brent spot price (FOB) through the Hormuz closure cycle and the Bab el-Mandeb embargo, January through July 2026. Chart: BlueLens Analytics, BLA-TR-2026-09. Data: U.S. Energy Information Administration, series RBRTE. See endnotes 4 through 7.
BLA-TR-2026-08, “Float or Drown: Data Centers, Sprawl, and the Constraints We Keep Choosing to Skip,” asked whether the American data-center buildout would design its constraints in from the start, before the water tables and interconnection queues forced the issue anyway.8 This report asks a version of the same question about a bigger and older system: the flow of the energy that runs everything else. The argument doesn’t change between the two papers. Design the constraint in before physics or geopolitics designs it in for you, or it gets designed in later, more expensively, by whoever has the least leverage when it happens. Sunlight doesn’t transit the Bab el-Mandeb, because it never has to: it falls directly on a panel already sited where the demand is, and it’s producing power before a tanker could even clear the strait. Neither does uranium that’s already loaded into a reactor core, already splitting atoms a thousand miles from any chokepoint. The question this report is actually asking is how much of the American and global economy could say the same thing, and what it would take to get there without pretending the fossil fuels underneath the current system don’t still have a real job to do.
I. Reject the Two Lazy Framings
There are two schools of thought on how to answer this week’s news, and they split along the country’s most predictable political line, each about as incomplete and naive as election-season sloganeering usually is.
The right’s answer is drill more, here, now, and the chokepoints stop mattering. It doesn’t, because the crude itself was never the whole constraint. Refining capacity, shipping insurance, and the physical geography of two straits the United States does not control are parts of the system that a domestic drilling permit cannot touch. The left’s answer is solar, wind, and efficiency get the world off oil fast enough that the question becomes moot. That doesn’t hold either, not on the timeline that matters, because the electricity those technologies produce cannot yet run, by itself, at the steady, dispatchable, all-hours load that a semiconductor manufacturing facility, a desalination plant, a steel mill, a biotechnology research campus, or a defense production line actually needs. Section III below is the argument for why storage is closing that gap for hours at a time. It is not yet the argument for why storage alone covers the winter week a factory cannot afford to stop running.
Both framings share the same error. They treat electricity as a lifestyle amenity, something that runs the air conditioner or charges the car, rather than what it actually is underneath: industrial substrate. The load that matters most here is not the residential kilowatt-hour. It’s the load behind the compute clusters BLA-TR-2026-08 already documented straining data-center siting nationwide, the load behind reshored semiconductor and battery manufacturing, the load behind the food production and cold storage warehouses that feed the citizenry, the load behind the domestic drone and robotics production the country is trying to rebuild, and the load behind desalination and defense production that has nothing to do with anyone’s thermostat.9 A chokepoint six thousand miles away raising the price of the diesel in a backup generator is an inconvenience. The same chokepoint raising the price, or breaking the reliability, of the baseload power a factory or a shipyard depends on is a vulnerability with a name.
II. Dinosaur Treasure, Properly Scoped
Fossil fuels are not going away, and shouldn’t. Petrochemicals, industrial process heat, and a long list of chemistry that has no ready substitute all still run on what a hundred and fifty million years of buried carbon left behind. Call it what it is: dinosaur treasure, a genuinely valuable, genuinely finite input that industrial civilization is right to keep using for the jobs only it can do.
The International Energy Agency’s own 2026 assessment puts a number on how much of the economy that actually is: energy-intensive industries, chemicals, metals, refining among them, account for roughly 30 percent of global manufacturing value added and 70 percent of industrial energy use, and energy alone can represent more than two-thirds of total production costs in those sectors.10 That is the legitimate, ongoing case for keeping fossil fuels in the industrial mix as feedstock and process input.
It is not a case for burning them as baseload fuel for a grid that has other options. Those are two different uses wearing the same barrel, and this report only argues against one of them. Stop burning dinosaur treasure for electricity you don’t need to burn it for. Keep using it for the chemistry that still needs it. The distinction is the whole argument, and it’s one that neither “drill baby drill” nor a blanket phase-out of fossil fuels bothers to make.
III. The Physical Case for the Pair
Solar power’s real limitation was never generation. On a clear day, utility-scale solar is now one of the cheapest ways to make a kilowatt-hour that exists, with 2026 unsubsidized costs running roughly $40 to $98 per megawatt-hour.11 The limitation was always firmness: the sun sets, clouds pass, and a grid built around solar alone has to cover those hours with something.
Battery storage is closing that gap, but it’s worth being precise about what kind of gap it’s closing. Standalone four-hour utility-scale storage now runs roughly $210 to $292 per megawatt-hour, itself up about 27 percent since 2020 even as the technology matures, and pairing it with solar brings blended costs to roughly $61 to $156 per megawatt-hour.11 EIA’s own market data shows developers adding 24 gigawatts of utility-scale battery storage in 2026, up from a then-record 15 gigawatts in 2025, and the share of new storage projects built for multi-hour “energy shifting” rather than short grid-stabilizing bursts has grown from about 40 percent of projects in 2015 to more than 90 percent in 2025.12 That’s real, fast progress. It’s also progress measured in hours, not in the multi-day, low-sun stretch of a January cold snap. Storage is a firming technology for an intermittent source. It was never designed, and isn’t being built, to substitute for baseload on its own.
Nuclear power’s real limitation was never safety in any way the data supports. It was capital and timeline: reactors that took a decade and tens of billions of dollars to build, financed at a scale only a handful of utilities in the world could absorb. Small modular reactors exist to fix exactly that problem, and 2026 is the year that stopped being a promise on a slide deck and started showing up as dated, verifiable events. On July 16, 2026, the Nuclear Regulatory Commission published a proposed rule, “Modernizing Reactor Licensing, Safety Oversight, and Siting Practices,” bundling seventeen measures that extend performance-based, risk-informed emergency planning to the whole advanced-reactor fleet rather than one design at a time.13 Under the Department of Energy’s Reactor Pilot Program, four separate advanced-reactor concepts, Antares Nuclear’s Mark-0 microreactor, Valar Atomics, Deployable Energy’s Unity high-temperature gas-cooled microreactor, and Aalo Atomics’ Aalo-X, all reached criticality between June 4 and July 4, 2026, meeting a program deadline that a decade ago would have sounded like fiction.14 TerraPower’s Natrium reactor, a sodium-cooled design paired with molten-salt storage, received its NRC construction permit on March 4, 2026, the first commercial reactor construction approval the agency has issued in nearly a decade and the first for a non-light-water design in more than forty years.15
Put the two technologies together and they stop competing and start covering for each other’s actual weakness. Solar-plus-storage handles the daily and weekly swing. SMR baseload handles the season, the cloudy week, and the industrial load that cannot tolerate a gap at all. Neither one, alone, is the whole answer. Paired deliberately, they cover the shape of demand a modern grid actually has, rather than the shape a single technology happens to produce.
IV. Architecture and Buildout Logistics
Getting from the physical case to an actual buildout means answering where these things go, and the honest answer is more contested than the marketing from any single reactor vendor suggests. The claim that helium-cooled reactor designs need dramatically less water than a conventional light-water plant, and can therefore site further inland, away from the coastal and river-adjacent locations that concentrated cooling water has always required, shows up throughout advanced-reactor marketing material.16 It is plausible on the engineering. It is not yet backed by a clean, independently verified, apples-to-apples water figure that this report was able to confirm, and at least one site-specific 2023 feasibility study on a coal-to-nuclear conversion candidate reportedly found the opposite for that particular configuration. That’s worth stating plainly rather than papering over: the siting-flexibility case for advanced reactors is real in direction, not yet proven in magnitude, and a serious buildout plan should treat it as an open engineering question rather than a settled advantage.
The brownfield and retired-coal case is on firmer ground. A 2022 study by Argonne, Idaho, and Oak Ridge National Laboratories, sponsored by the Department of Energy, screened 349 retired and 273 operating coal sites nationwide and found that roughly 80 percent of them have the basic site characteristics, existing grid interconnection, transmission rights-of-way, water access, workforce proximity, to host an advanced reactor of some kind.17 A follow-on 2023 Bipartisan Policy Center analysis found that reusing a retiring coal plant’s electrical infrastructure, steam cycle, and site improvements could cut SMR construction costs by somewhere between 17 and 35 percent, and that 77 percent of a coal plant’s existing workforce could transfer into nuclear operating roles without new licensing requirements.18 That is the fastest-permitting, most politically defensible path available: land that already has an industrial identity, a grid connection, and a community used to the idea of a power plant next door.
It is also not a guaranteed outcome, and one real 2026 case makes that plain rather than theoretical. Coronado Generating Station in Apache County, Arizona, was studied as a coal-to-nuclear candidate under exactly this framework. On March 4, 2026, the Arizona Corporation Commission voted 5-0 to convert its coal units to natural gas by 2029 instead, as the lower-cost near-term bridge, with advanced nuclear held out explicitly as a possible option for the site in the mid-2040s once the technology matures further.19 That is a coal-to-gas story today, with nuclear parked as a future option, not a present win. Reporting the buildout case honestly means including outcomes like Coronado alongside the successes, not just the sites where the model worked.
The regional pairing logic, solar-heavy states carrying daytime surplus while SMR baseload covers the gaps, plays out differently depending on what’s actually driving load growth in a given region, and the two biggest western grid operators make an instructive contrast. In California, roughly two-thirds of CAISO’s projected 2025 to 2030 load growth comes from electrification itself, transportation at about 35 percent and building electrification at about 30 percent, with data centers accounting for only around 30 percent, the inverse of the pattern in Texas or the mid-Atlantic.20 CAISO’s own 2026 summer assessment shows a capacity surplus of roughly 2,547 megawatts against its reliability standard, driven by heavy solar, wind, and battery storage additions.21 That’s a genuine counterexample to the capacity-crunch story the rest of this report tells in Section V, and it’s worth naming directly rather than around: where the grid operator has spent a decade building solar and storage at scale, and where electrification rather than data centers is the dominant new load, the near-term picture looks meaningfully better. It is also the exception, not the rule, among the country’s major grid operators, for reasons Section V lays out.
V. The Demand You’re Already Creating
Electricity demand in the United States grew by 2 percent in 2024 and is forecast to grow another 2 percent in both 2025 and 2026, the first three consecutive years of growth since 2005 to 2007.22 EIA’s own long-range outlook projects total US electricity generation rising roughly 50 percent by 2050, from about 4,000 to 6,000 terawatt-hours, driven by exactly the mix this report has been describing: electric vehicles, heat pumps, and data centers layering onto the same grid at once.23 EIA and DOE’s public communications through 2025 and 2026 talk about data centers far more than they isolate a standalone figure for heat pumps or induction appliances specifically, which is itself worth noting: the electrification piece of this demand story is real but harder to pin to a single government number than the data-center piece is.
The generation side of that equation is not keeping pace, and PJM, the grid operator serving 67 million people across thirteen states and the mid-Atlantic, is the clearest example. Its most recent capacity auction, held July 14, 2026 for the 2028/2029 delivery year, cleared at $325 per megawatt-day and still fell 6,831 megawatts short of PJM’s own 20 percent reliability reserve margin, the third consecutive auction to miss that target and the first time in PJM’s history that the entire grid region has fallen short at once.24 PJM’s own CEO, David Mills, put it plainly: “demand for electricity continues to grow faster than electricity supply.”24 The cost of that shortfall is not abstract. The prior delivery year’s auction cost consumers $14.7 billion, up from $2.2 billion the cycle before, and PJM is now seeking emergency federal approval for a special backstop generation procurement to cover the near-term gap.25
ERCOT, the Texas grid operator, is heading the same direction from a different angle: its December 2025 capacity report shows firm summer peak demand rising from 88.6 gigawatts in 2026 to 132.2 gigawatts in 2030, a five-year increase of roughly 43.6 gigawatts, against a reserve margin that the same report shows declining every year over that span, from 18.3 percent in 2026 to 11.4 percent in 2027 and negative 1.3 percent in 2028, reaching negative 12.7 percent by 2030 under its base planning scenario.26 That 18.3 percent is still comfortably above ERCOT’s own 13.75 percent target, a surplus of roughly 4,000 megawatts today, which is exactly what makes the trajectory worth watching rather than dismissing: the same base case crosses below target within a year and goes negative the year after that.
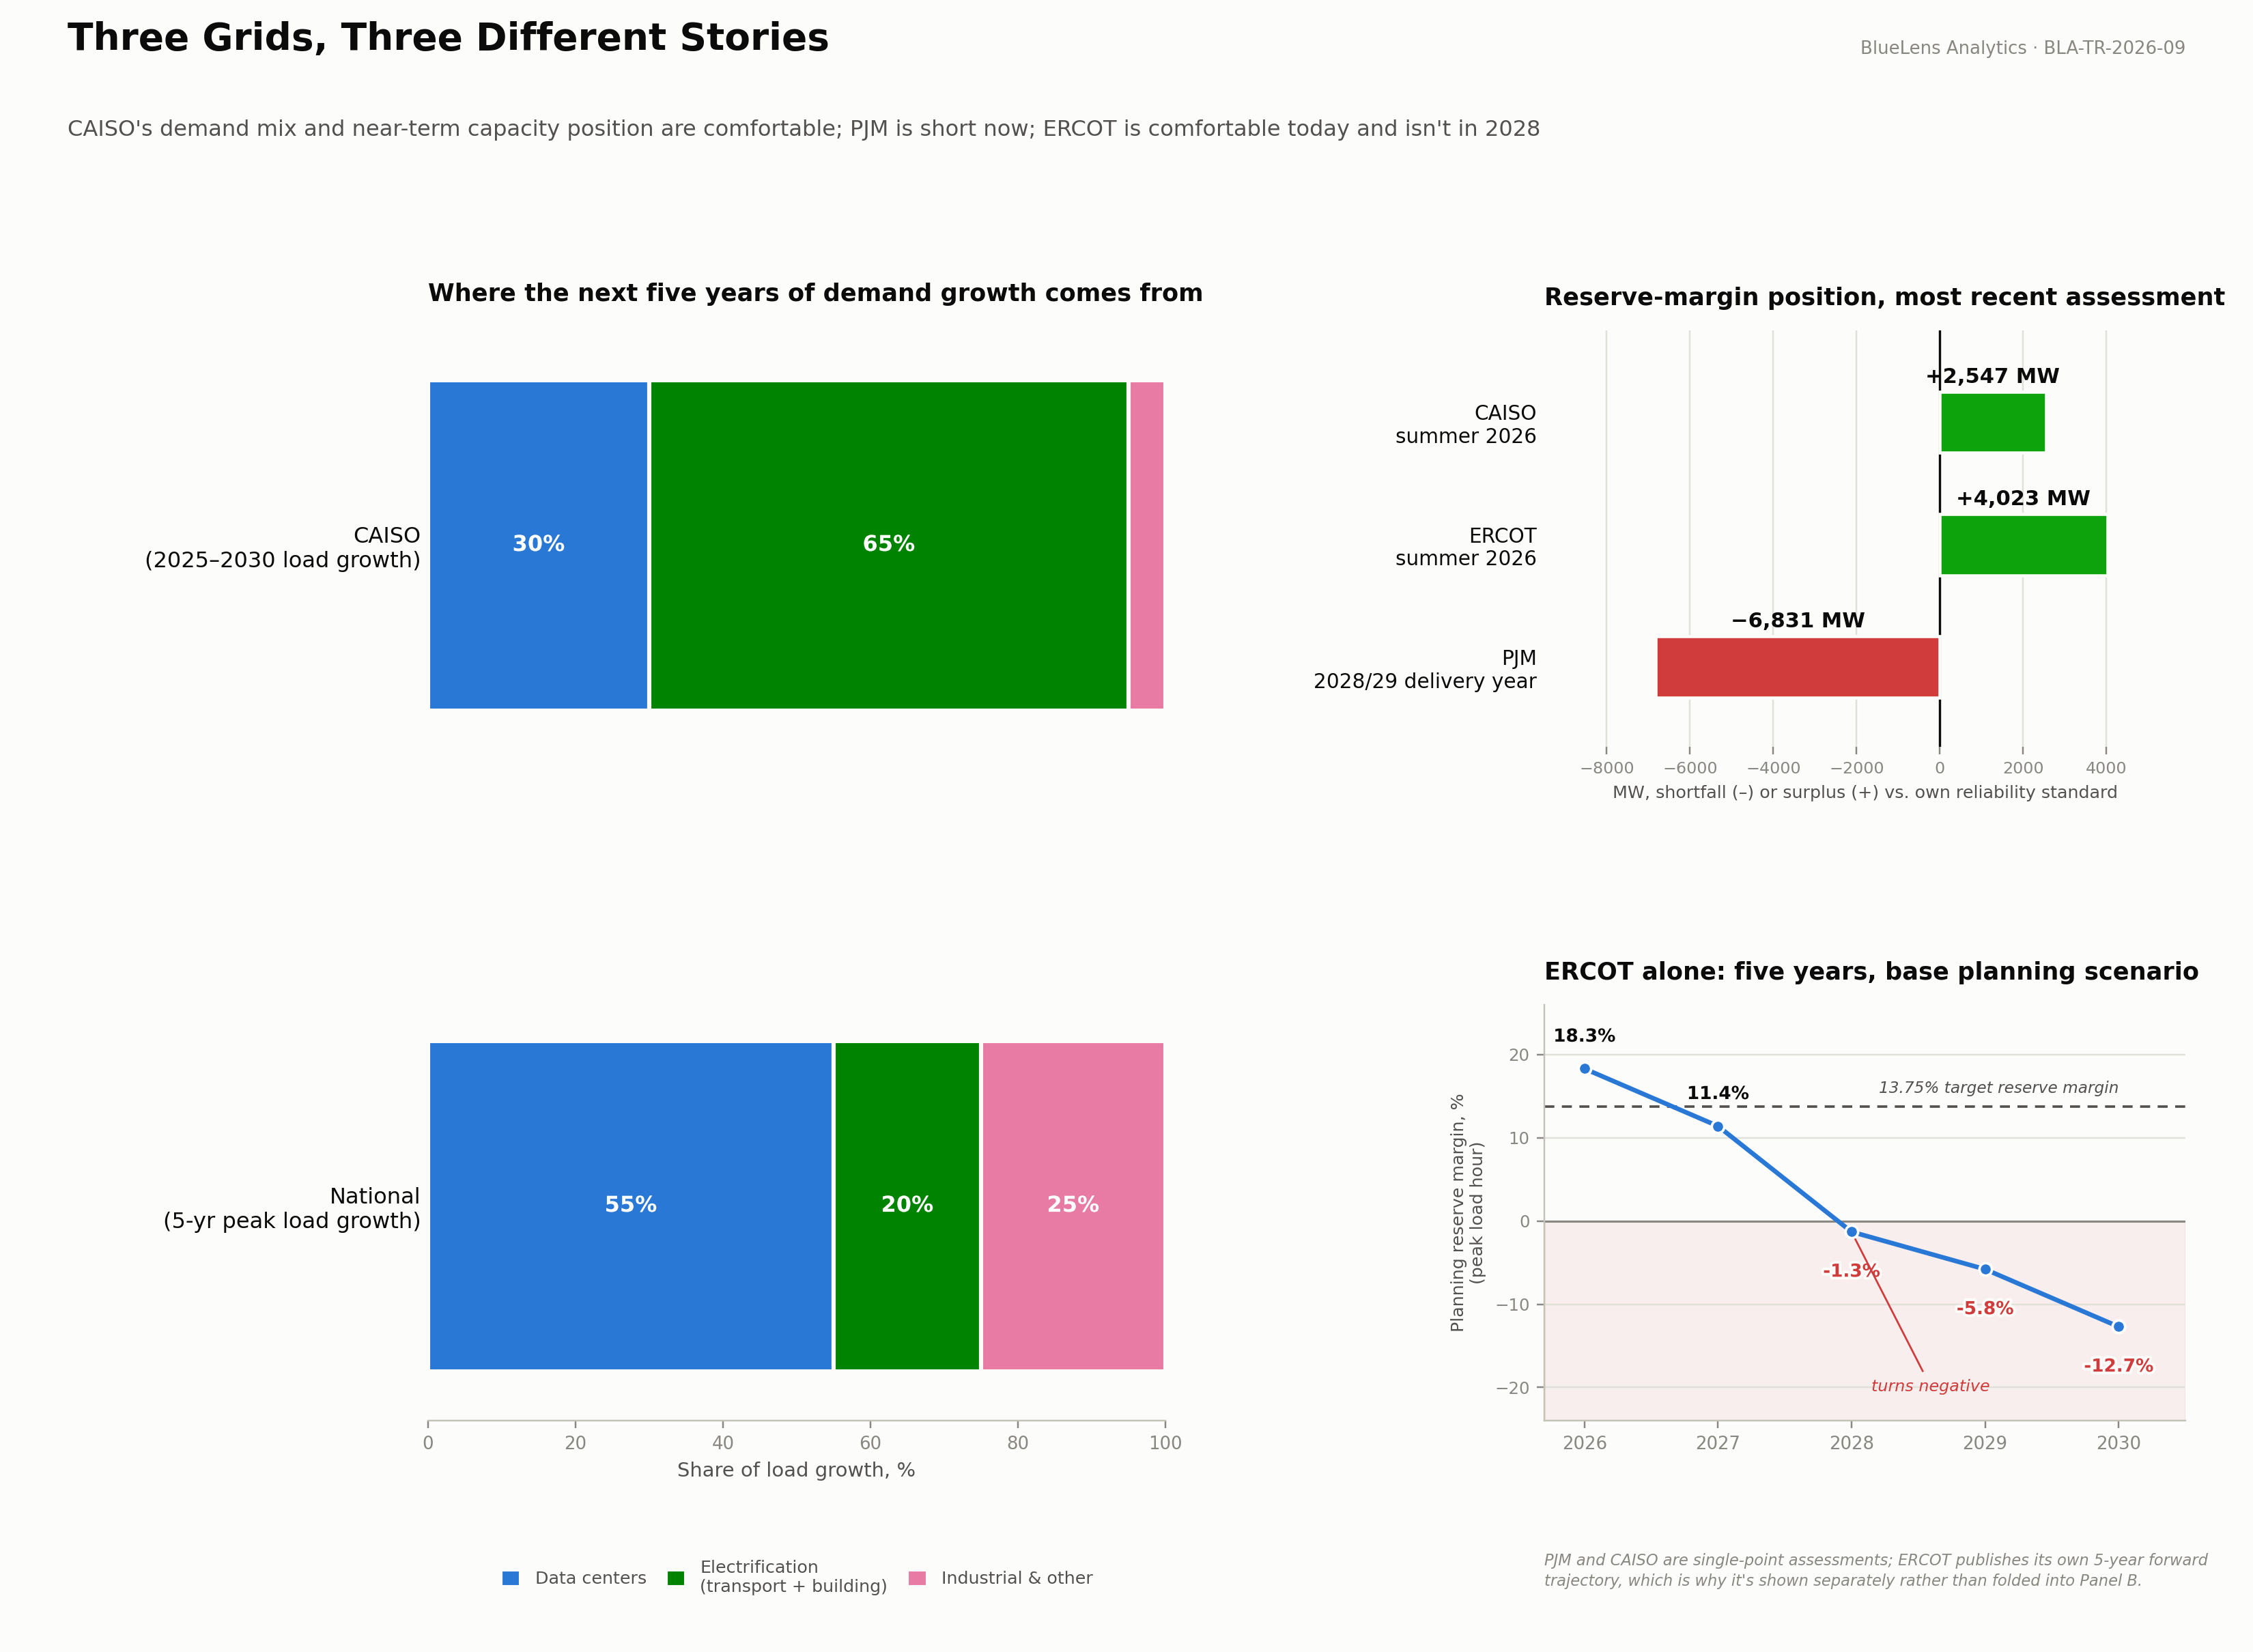
Figure 3. CAISO’s demand mix and capacity position are comfortable both near and long term; PJM is already short; ERCOT is comfortable today on a trajectory that isn’t. Chart: BlueLens Analytics, BLA-TR-2026-09. Data: CAISO 2026 Summer Loads and Resources Assessment, PJM 2028/29 Base Residual Auction results, ERCOT December 2025 Capacity, Demand and Reserves Report. See endnotes 20, 21, 24, 26, and 28.
Zoom out from any single grid operator and the national trend looks the same as ERCOT’s, just averaged across every region at once. NERC’s most recent Long-Term Reliability Assessment, published in January 2026, forecasts national summer peak demand rising 224 gigawatts over the next decade, a 69 percent increase over what the same report projected just one year earlier, with thirteen of twenty-three regional assessment areas now rated at elevated or high resource-adequacy risk.27 Against that growth, utilities have announced plans to retire more than 55,000 megawatts of coal capacity between 2026 and 2030, on a timeline set by cost and regulation rather than by whatever is actually available to replace it.27 An independent analysis built from utilities’ own federal filings puts the national five-year peak load growth figure at 166 gigawatts, six times higher than the same kind of forecast made just three years ago, with data centers responsible for about 55 percent of that growth, industrial reshoring for another 20 percent, oil and gas operations for about 5 percent, and the ordinary electrification of homes and vehicles for the remaining 20 percent.28 The same analysis found that only 888 miles of new high-voltage transmission were built in 2024, against a Department of Energy estimate that the country needs roughly 5,000 miles a year to keep up.28
There is an unexamined premise sitting underneath a lot of individual decisions to electrify a home or a car, and it deserves to be named without moralizing about it: someone else’s generation is assumed to show up to meet demand that a person is personally adding to the grid, without that same person siting it, permitting it, or living near it. A heat pump and an EV charger are genuinely good decisions on their own terms. They are also new load, arriving on a grid that Sections IV and V of this report have just shown is not adding supply at the same pace. The interconnection queues, the missed capacity auctions, and the coal retirements running ahead of replacement generation are not a separate problem from the choice to electrify. They are the other half of the same choice, and treating them as somebody else’s siting fight is the exact contradiction this report is naming plainly rather than pretending isn’t there.
VI. The Global South and the Smug Entitled North
There is a familiar posture in how the wealthy world talks to the developing one about emissions: don’t build the coal plants, don’t run the diesel generators, don’t do the hundred and fifty years of dirty industrialization that built the first world’s own wealth, do better, do it now, on somebody else’s dime and somebody else’s timeline. That posture, aimed outward, is smugness wearing the language of concern. A country that finished its own industrialization on fossil fuels a century ago does not get to lecture a country still finishing the same climb.
The same posture shows up pointed inward, at a domestic audience, and it wears two different aesthetics that share one instinct. One version tells people what they may drive or heat their home with, on a timeline set by activists rather than by what the grid described in Section V can actually deliver. Another waves off cost and reliability concerns as ignorance, confident that the market or the technology will simply catch up to whatever policy gets set first. Different vocabulary, same underlying claim: we already know the answer, your job is to comply. BlueLens Analytics doesn’t work that way. The argument in this report is a technical one, made with the numbers Sections III through V just laid out, not a moral one made from a position of assumed authority. State the physics and the economics plainly, let the argument stand or fall on whether the numbers hold, and skip the posture entirely.
Who Profits From the Swing
There’s a second audience for chokepoint volatility that neither the drill-more crowd nor the solar-will-save-us crowd talks about much, and it’s worth naming plainly rather than gesturing at vaguely: trading desks and commodity merchants, whose profits track price volatility itself, not any particular direction of that price.
The pattern shows up cleanly in the data whenever markets get disrupted and then calm back down. Shell posted a record $39.9 billion profit in 2022, with its LNG trading division alone earning a record $6 billion, driven, in the company’s own words, by “strong overall trading earnings on the back of gas price volatility.”29 Glencore’s marketing division posted a record $6.4 billion adjusted profit that same year, up 73 percent, with its energy-trading unit alone up 273 percent to $5.2 billion; Glencore’s own results release credited it to “our energy departments successfully navigating the extreme market imbalances, volatility and dislocations across crude oil, LNG, refined products, coal and logistics infrastructure,” and the company raised its internal risk limits specifically because of what it called “statistically elevated energy market risk.”30 Vitol posted a record $15 billion profit in 2022, matching its combined earnings from the previous six years.31 Trafigura posted an $1.6 billion profit in 2020, up 84 percent, trading the chaos of the COVID-era price collapse, when US crude briefly went negative.32 The same company’s profit then fell 73 percent in 2024, to its lowest level since that 2020 crisis year, as markets normalized and had less volatility to trade.33 That contrast, big profits in the chaotic years, smaller ones in the calm ones, is the whole mechanism in miniature: the money isn’t made on price going up or down. It’s made on price moving.
TotalEnergies’ CEO has put a steady number on it directly, telling investors the company’s oil trading arm earns roughly $2 billion a year on average, with quarterly gains that typically run around $500 million doubling to roughly $1 billion in the first quarter of 2026 amid a Middle East-driven buying spree tied to the same conflict opening this report.34 Shell’s own first-quarter 2026 results, released as the Iran war pushed Brent up more than 50 percent, described the disruption in terms that could double as a mission statement for this section: it created “dislocations across energy markets, sending physical premiums surging” and “creating the conditions in which commodity merchants tend to thrive.”35
None of this requires assuming coordination or conspiracy to observe. It requires naming the tooling, because the tooling has an actual name and a much longer history than most people crediting it to recent AI hype realize. Robert Engle’s foundational 1982 paper on modeling volatility, later generalized into the GARCH framework still taught today, won him the Nobel Memorial Prize in Economic Sciences in 2003.36 Renaissance Technologies was founded in 1982, and its Medallion Fund, launched in 1988, built its early edge trading commodity futures with mathematical models that predate the personal computer as most people know it.37 Bridgewater Associates dates to 1975, Citadel to 1990.38 Volatility forecasting and systematic trading on exactly the kind of chokepoint-driven price swings this report opened with is a mature, decades-old discipline in institutional finance, not a metaphor and not a conspiracy theory. Everyone else heard about generative AI a couple of years ago. Trading desks have been running sophisticated time-series models on this exact kind of volatility since long before that. The asymmetry in who has the tooling to trade a chokepoint event, versus who just pays the price at the pump because of one, is real, and it’s worth naming plainly rather than dressing it up as either a scandal or a shrug.
The chokepoint-to-price link itself is real but not mechanical, and an honest report says so. Brent jumped 4.2 percent within a day of the October 2023 Hamas attack on Israel, and both Brent and WTI rose roughly 4.5 percent in a single week during the December 2023 escalation of Houthi Red Sea attacks.39 But coverage from the following month also noted, correctly, that the broader run of 2023 to 2024 Houthi attacks on shipping moved energy markets less than the initial spike suggested they would, as markets adjusted to sustained disruption rather than a single shock.40 Markets price in the first surprise hard and the tenth one less so. That’s a real complication for anyone tempted to draw a straight line from every chokepoint headline to every price move, and it belongs in this report rather than being smoothed over.
None of that changes the basic asymmetry this section is pointing at. A power grid that prices off its own domestic generation cost curve, solar built here, storage built here, an SMR built here, isn’t waiting on a Yemeni militia’s press release or a derivatives desk’s volatility book to find out what it costs to keep the lights on next quarter. That’s not a slogan. It’s the direct, mechanical consequence of Sections III and IV: build the generation domestically, and the chokepoint six thousand miles away stops being able to set your price, because your price was never routed through it in the first place.
This is the same lens BlueLens Analytics has applied to Haiti and to Ukraine in the Sustainable War series: conflict is an economic input for some and a cost for everyone else, and the chokepoint pattern documented in this report’s opening section is that same dynamic, playing out in real time, in a waterway instead of a warzone.41
VII. Resilience, Not Righteousness
The case this report is making was never that domestic SMR and solar-plus-storage is cleaner. It might be. That’s not the argument. The argument is narrower and, BlueLens believes, harder to dismiss: a Yemeni militia’s press release shouldn’t be able to move the price of electricity in an American factory, a European hospital, or anywhere else a grid was built with its own domestic generation underneath it instead of a six-thousand-mile supply line running through two straits currently closed at the same time.
Dinosaur treasure still has a job, in the plastics, the fertilizer, and the industrial chemistry that has no ready substitute. It doesn’t need to have the job of keeping a factory’s lights on when the alternative, uranium already loaded into a reactor and sunlight already falling on a panel a state away, is sitting there, immune to a strait, a tanker attack, or a press release, by physical design rather than by anyone’s good intentions.
Build the grid that doesn’t have to check the news before it knows what tomorrow’s power costs. Or build the one that does, and call the volatility bad luck instead of the design choice it actually was.
-
“Yemen’s Houthis threaten Bab el-Mandeb closure in embargo on Saudi Arabia,” Euronews, July 20, 2026. https://www.euronews.com/2026/07/20/yemens-houthis-threaten-bab-el-mandeb-closure-in-embargo-on-saudi-arabia ; “Yemen’s Houthis declare naval blockade of Saudi Arabia: What to know,” Al Jazeera, July 20, 2026. https://www.aljazeera.com/news/2026/7/20/yemens-houthis-declare-naval-blockade-of-saudi-arabia-what-to-know ↩
-
“Houthis’ blockade on Saudi Red Sea oil transits threatens to widen war, strangle energy supply,” TWZ, July 2026. https://www.twz.com/news-features/houthis-blockade-on-saudi-red-sea-oil-transits-threatens-to-widen-war-strangle-energy-supply ; “Yemen’s Iranian-backed Houthis announce a maritime embargo against Saudi Arabia,” PBS NewsHour (AP), July 20, 2026. https://www.pbs.org/newshour/world/yemens-iranian-backed-houthis-announce-a-maritime-embargo-against-saudi-arabia ↩
-
U.S. Energy Information Administration, “World Oil Transit Chokepoints,” data as of 1H2025. https://www.eia.gov/international/content/analysis/special_topics/World_Oil_Transit_Chokepoints/ ; “Yemen’s Houthis declare naval blockade of Saudi Arabia: What to know,” Al Jazeera, July 20, 2026 (trade-value and container-share figures). https://www.aljazeera.com/news/2026/7/20/yemens-houthis-declare-naval-blockade-of-saudi-arabia-what-to-know ↩
-
U.S. Energy Information Administration, “World Oil Transit Chokepoints,” data as of 1H2025. https://www.eia.gov/international/content/analysis/special_topics/World_Oil_Transit_Chokepoints/ ; “2026 Strait of Hormuz campaign,” Wikipedia, accessed July 21, 2026 (secondary source; dates cross-referenced against contemporaneous news coverage where possible). https://en.wikipedia.org/wiki/2026_Strait_of_Hormuz_campaign ↩
-
“2026 Strait of Hormuz campaign,” Wikipedia, accessed July 21, 2026. https://en.wikipedia.org/wiki/2026_Strait_of_Hormuz_campaign ↩
-
U.S. Energy Information Administration, “Europe Brent Spot Price FOB” (series RBRTE), daily historical data, last updated July 15, 2026. https://www.eia.gov/dnav/pet/hist_xls/RBRTEd.xls ; “Iran shuts Hormuz strait: But wasn’t it already closed?” Al Jazeera, June 11, 2026. https://www.aljazeera.com/news/2026/6/11/iran-shuts-hormuz-strait-but-wasnt-it-already-closed ↩
-
“Saudi Arabia suspends oil exports through Bab al-Mandeb,” Al Jazeera, July 26, 2018. https://www.aljazeera.com/news/2018/7/26/saudi-arabia-suspends-oil-exports-through-bab-al-mandeb ↩
-
BLA-TR-2026-08, “Float or Drown: Data Centers, Sprawl, and the Constraints We Keep Choosing to Skip,” BlueLens Analytics, July 2026. https://bluelensanalytics.com/blog/posts/float-or-drown-data-centers.html ↩
-
BLA-TR-2026-08, “Float or Drown: Data Centers, Sprawl, and the Constraints We Keep Choosing to Skip,” BlueLens Analytics, July 2026. https://bluelensanalytics.com/blog/posts/float-or-drown-data-centers.html ↩
-
“Supply chain risks and industrial competitiveness,” Energy Technology Perspectives 2026, International Energy Agency, 2026. https://www.iea.org/reports/energy-technology-perspectives-2026/supply-chain-risks-and-industrial-competitiveness ↩
-
Lazard, “2026 Levelized Cost of Energy+ Report,” July 13, 2026. https://www.lazard.com/news-announcements/lazard-releases-2026-levelized-cost-of-energyplus-report-pr/ ; “Battery storage costs up 27% since 2020, says Lazard,” Energy Storage News, July 13, 2026. https://www.ess-news.com/2026/07/13/battery-storage-costs-up-27-since-2020-says-lazard/ ↩↩
-
U.S. Energy Information Administration, “U.S. Battery Storage Market Trends,” March 17, 2026. https://www.eia.gov/analysis/studies/electricity/batterystorage/ ↩
-
“Modernizing Reactor Licensing, Safety Oversight, and Siting Practices,” U.S. Nuclear Regulatory Commission proposed rule, Federal Register, July 16, 2026. https://www.federalregister.gov/documents/2026/07/16/2026-14341/modernizing-reactor-licensing-safety-oversight-and-siting-practices ↩
-
U.S. Department of Energy, “Reactor Pilot Program.” https://www.energy.gov/ne/us-department-energy-reactor-pilot-program ; “Deployable Energy achieves criticality at INL,” American Nuclear Society Nuclear Newswire, July 1, 2026. https://www.ans.org/news/2026-07-01/article-8175/deployable-energy-achieves-criticality-at-inl/ ; “Criticality for fourth US microreactor meets deadline,” World Nuclear News. https://www.world-nuclear-news.org/articles/criticality-for-fourth-us-microreactor-meets-deadline ↩
-
TerraPower, “NRC Approves Natrium Reactor Construction Permit,” March 2026. https://www.terrapower.com/NRC-Approves-Natrium-Reactor-Construction-Permit ; U.S. Nuclear Regulatory Commission press release 26-028. https://www.nrc.gov/sites/default/files/cdn/doc-collection-news/2026/26-028.pdf ↩
-
X-energy, “Xe-100: High-Temperature Gas-Cooled Nuclear Reactors (HTGR),” vendor materials. https://x-energy.com/xe-100/ ; World Nuclear Association, “Is the Cooling of Power Plants a Constraint on the Future of Nuclear Power?” (standing technical position, dated May 2020). https://world-nuclear.org/our-association/publications/technical-positions/cooling-of-power-plants ↩
-
“US study assesses potential for coal-to-nuclear conversion,” World Nuclear News, September 14, 2022, summarizing the Argonne/Idaho/Oak Ridge National Laboratory study sponsored by the U.S. Department of Energy Office of Nuclear Energy. https://world-nuclear-news.org/Articles/US-study-assesses-potential-for-coal-to-nuclear-co ↩
-
“Coal plants could retire, replaced by advanced nuclear reactors,” Utility Dive, March 27, 2023, summarizing Bipartisan Policy Center report “Can Advanced Nuclear Repower Coal Country?” by John Jacobs and Lesley Jantarasami, March 2023. https://www.utilitydive.com/news/coal-plants-retire-advanced-nuclear-reactors-smr/645974/ ↩
-
Arizona Corporation Commission, “Commissioner Thompson votes to convert Springerville and Coronado Generating Stations to natural gas,” March 4, 2026. https://azcc.gov/kevin-thompson/news/2026/03/04/commissioner-thompson-votes-to-convert-springerville-and-coronado-generating-stations-to-natural-gas ↩
-
Grid Strategies, “Power Demand Forecasts Revised Up for Third Year Running, Led by Data Centers,” November 2025, citing the California Energy Commission’s Final 2024 Integrated Energy Policy Report Update. https://gridstrategiesllc.com/wp-content/uploads/Grid-Strategies-National-Load-Growth-Report-2025.pdf ↩
-
California Independent System Operator, “2026 Summer Loads and Resources Assessment.” https://www.caiso.com/documents/2026-summer-loads-and-resources-assessment.pdf ↩
-
U.S. Energy Information Administration, “EIA publishes its first energy-sector forecasts through 2026,” press release, January 14, 2025. https://www.eia.gov/pressroom/releases/press564.php ↩
-
U.S. Energy Information Administration, “Annual Energy Outlook 2025,” April 15, 2025. https://www.eia.gov/outlooks/aeo/narrative/ ↩
-
PJM Interconnection, “2028/2029 Base Residual Auction Results,” press release, July 14, 2026. https://www.pjm.com/-/media/DotCom/about-pjm/newsroom/2026-releases/20260714-pjm-capacity-auction-procures-138318-mw-of-generation-resources.pdf ↩↩
-
“FERC members raise alarms about PJM failure to meet reliability target,” Utility Dive. https://www.utilitydive.com/news/ferc-pjm-reliability-data-center-large-load/808352/ ; Grid Strategies, “Penny-Wise and Pound Foolish,” February 2025 (2025/26 delivery-year auction cost figures). ↩
-
Electric Reliability Council of Texas, “Capacity, Demand and Reserves Report,” December 19, 2025. https://www.ercot.com/files/docs/2025/12/19/CapacityDemandandReservesReport_December2025.pdf ↩
-
North American Electric Reliability Corporation, “2025 Long-Term Reliability Assessment,” published January 2026. https://www.nerc.com/globalassets/our-work/assessments/nerc_ltra_2025.pdf ; “NERC forecasts peak demand to rise 24% on new data center loads,” Utility Dive. https://www.utilitydive.com/news/nerc-10-year-peak-demand-forecast-jumps-24-on-new-data-center-loads/810955/ ↩↩
-
Grid Strategies, “Power Demand Forecasts Revised Up for Third Year Running, Led by Data Centers,” November 2025, citing FERC Form 714 utility filings, NERC’s 2024 Long-Term Reliability Assessment, and EIA’s Monthly Energy Review. https://gridstrategiesllc.com/wp-content/uploads/Grid-Strategies-National-Load-Growth-Report-2025.pdf ↩↩
-
Shell plc, Form 6-K, Annual Accounts 2022, filed with the U.S. Securities and Exchange Commission. https://www.sec.gov/Archives/edgar/data/1306965/000130696523000011/a6-kshellannualaccounts2022.htm ; “Shell makes record $40 billion annual profit,” Investing.com/Reuters, February 2, 2023. https://www.investing.com/news/stock-market-news/shell-makes-record-40-billion-annual-profit-2993819 ↩
-
Glencore plc, “Preliminary Results 2022,” February 15, 2023. https://www.glencore.com/media-and-insights/news/preliminary-results-2022 ↩
-
“Vitol posts record $15bn profits,” Offshore Technology, February 2023, citing Financial Times reporting. https://www.offshore-technology.com/news/vitol-posts-record-15bn-profits/ ↩
-
“Oil trader Trafigura extracted record profits from oil market carnage,” Forbes, December 15, 2020. https://www.forbes.com/sites/scottcarpenter/2020/12/15/oil-trader-trafigura-extracted-record-profits-from-oil-market-carnage/ ↩
-
“Big Oil’s Trading Arms Struggle to Navigate Volatility,” OilPrice.com, 2026. https://oilprice.com/Energy/Energy-General/Big-Oils-Trading-Arms-Struggle-to-Navigate-Trump-Era-Volatility.html ↩
-
“TotalEnergies Oil Trading Reaps $2 Billion Per Year, CEO Says,” Bloomberg, May 29, 2026. https://www.bloomberg.com/news/articles/2026-05-29/totalenergies-oil-trading-reaps-2-billion-per-year-ceo-says ↩
-
“Shell Profit Soars as Volatility Boosts Trading,” Rigzone, May 7, 2026. https://www.rigzone.com/news/wire/shell_profit_soars_as_volatility_boosts_trading-07-may-2026-183629-article/ ↩
-
Engle, Robert F. “Autoregressive Conditional Heteroscedasticity with Estimates of the Variance of United Kingdom Inflation,” Econometrica, Vol. 50, 1982, pp. 987-1008. https://www.econometricsociety.org/publications/econometrica/1982/07/01/autoregressive-conditional-heteroscedasticity-estimates ; Engle, Robert F., Nobel Prize Lecture, 2003. https://www.nobelprize.org/uploads/2018/06/engle-lecture.pdf ↩
-
“Renaissance Technologies,” Wikipedia, accessed July 21, 2026. https://en.wikipedia.org/wiki/Renaissance_Technologies ↩
-
“Bridgewater Associates,” Wikipedia, accessed July 21, 2026. https://en.wikipedia.org/wiki/Bridgewater_Associates ; “Citadel LLC,” Wikipedia, accessed July 21, 2026. https://en.wikipedia.org/wiki/Citadel_LLC ↩
-
“Oil prices spike after Hamas attack on Israel,” CNN, October 9, 2023. https://www.cnn.com/2023/10/09/energy/oil-prices-israel-hamas-conflict-explainer/index.html ; “Houthi militant attacks rebound crude oil prices during end of December 2023,” ChemAnalyst, December 2023. https://www.chemanalyst.com/NewsAndDeals/NewsDetails/houthi-militant-attacks-rebound-crude-oil-prices-during-end-of-december-2023-24255 ↩
-
“Why Haven’t Houthi Attacks Hit Energy Markets Yet?” Foreign Policy, January 18, 2024. https://foreignpolicy.com/2024/01/18/red-sea-crisis-energy-oil-houthi-attacks-shipping/ ↩
-
BlueLens Analytics, “Sustainable War” series: BLA-TR-2026-04, “Sustainable War, Tested on Humans — Haiti.” https://bluelensanalytics.com/blog/posts/sustainable-war-tested-on-humans.html ; BLA-TR-2026-05, “Sustainable War, Tested on Humans — Ukraine.” https://bluelensanalytics.com/blog/posts/sustainable-war-tested-on-humans-ukraine.html ↩