When Hurricane Helene tore through western North Carolina in September 2024, the damage to communities like Asheville and the surrounding mountain counties was catastrophic. Roads washed out. Bridges gone. Entire neighborhoods cut off. And for the first 48 to 72 hours, nobody had a clear picture of the full extent of it, because you can’t drive roads that don’t exist anymore, and helicopters can only cover so much ground.
What most people don’t know is that a satellite had already seen it. All of it. Within hours.
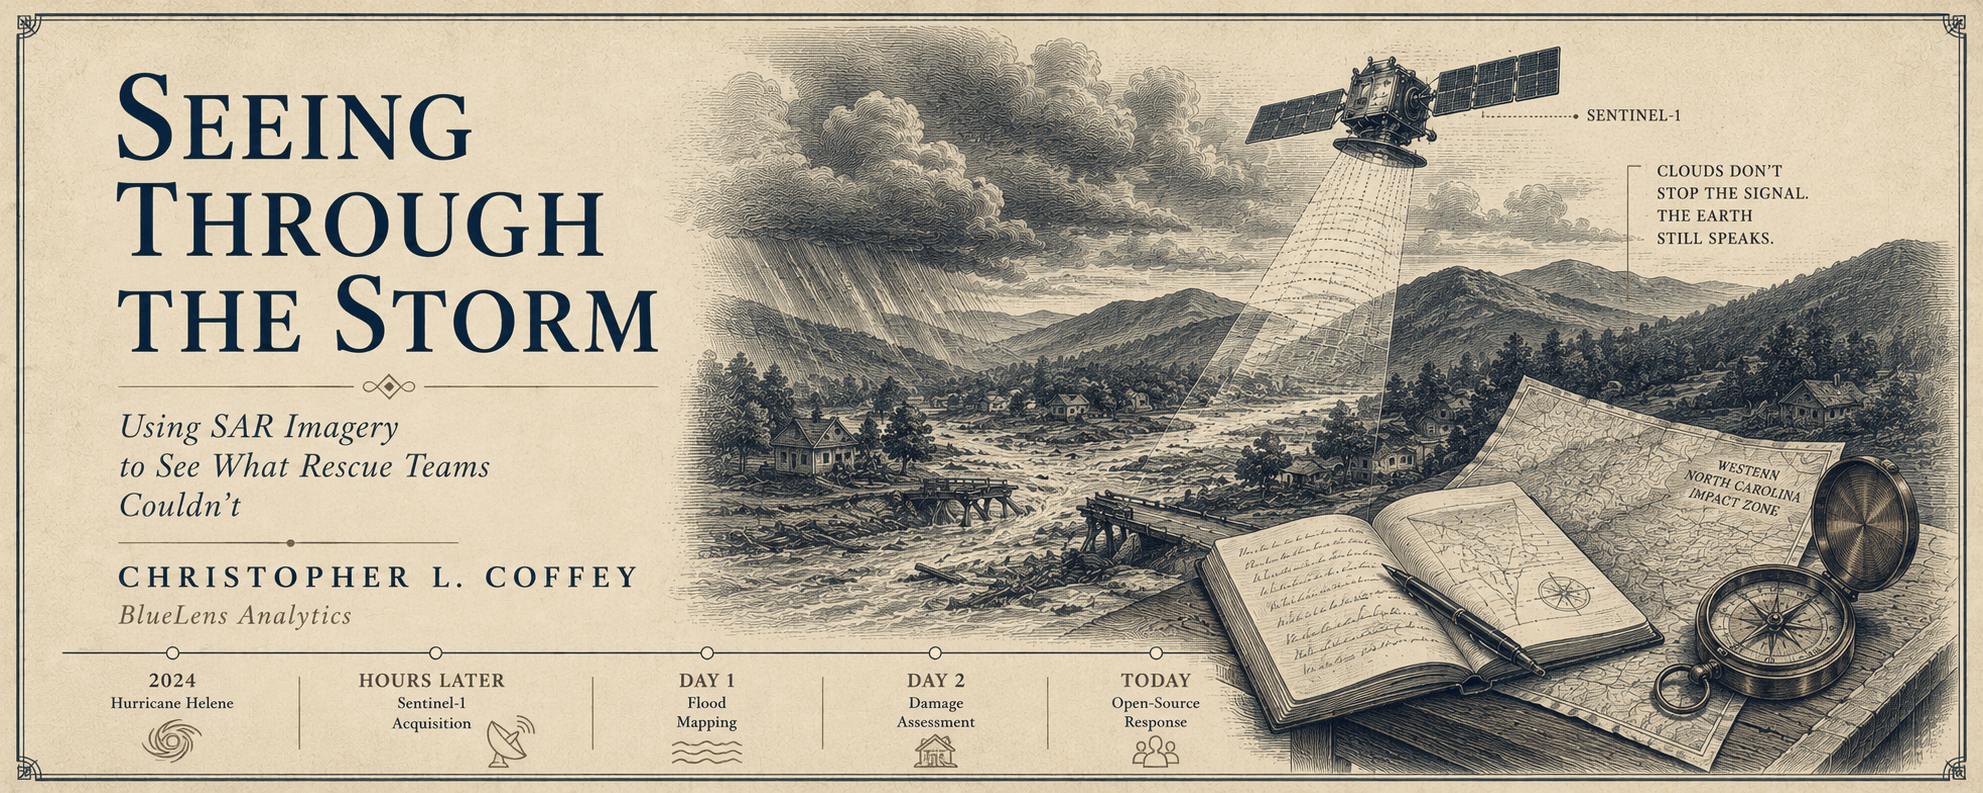
Synthetic aperture radar, or SAR, doesn’t care about clouds, smoke, or darkness. It sends its own signal down and reads what bounces back. Where optical satellites go blind in bad weather, SAR keeps working. And in the hours after a major flood event, when the skies are still overcast and the optical record is useless, SAR is often the only source of usable imagery.
The data existed. The gap was between what the satellites captured and what the people making decisions on the ground could actually access and interpret.
Using ESA’s freely available Sentinel-1 SAR archive and an entirely open-source processing pipeline, I built a damage assessment proof of concept for the Helene impact zone, comparing pre- and post-storm backscatter values across the affected area to identify where inundation and structural change had occurred. The output was a damage probability surface: a map that showed not just where flooding happened, but where the signal changed enough to suggest something more permanent.
The processing runs on ESA’s own SNAP toolchain, purpose-built for Sentinel data, and automated in Python using pyroSAR. From there the analysis moves into QGIS for geoprocessing: clipping to county boundaries, overlaying against road networks and population centers, and generating cartographic output that an emergency manager can actually hand to someone in a briefing. No proprietary licenses. No platform dependencies. No subscription fees. Just the data, the tools, and the analysis.
That matters more than it might seem. Most of the organizations that need this capability most, including local emergency management agencies, humanitarian NGOs, and rural counties without deep IT budgets, can’t afford enterprise GIS platforms. The open-source stack removes that barrier entirely. Sentinel-1 data is free. SNAP is free. QGIS is free. The only thing required is the expertise to put it together, and the judgment to know what you’re looking at when it comes out the other end.
This kind of analysis used to require classified facilities, specialized software, and a team of cleared analysts. Now it runs on open tools, on public data, in hours. The barriers aren’t technical anymore. They’re organizational.
Most disaster response agencies don’t have geospatial analysts on staff. They don’t have workflows for ingesting this kind of data, and they don’t know where to start. The imagery is there. The interpretation, the workflow, the translation into something a logistics coordinator can actually use, that’s where the work is.
That’s also exactly what BlueLens Analytics was built to do.
TECHNICAL DETAIL
Sentinel-1 GRD scenes in IW mode, VV polarization are acquired programmatically via the Copernicus Data Space Ecosystem API using sentinelsat. Pre- and post-event scenes are processed through ESA SNAP via pyroSAR automation in Python, applying thermal noise removal, radiometric calibration, and terrain correction against the SRTM DEM. Change detection is computed as the log-ratio of pre- and post-event backscatter in dB, with significant negative values indicating probable inundation or structural loss.
Processed GeoTIFFs move into QGIS for downstream geoprocessing: zonal statistics against administrative boundaries, vector overlays with road and structure networks, and final cartographic output. The full chain from scene download to cartographic output runs without a single proprietary dependency. The same workflow scales to conflict damage assessment, infrastructure monitoring, and agricultural change detection.